Motadata Time Out
##Case 1
If Getting Error of Time Out Find Steps to Get out of this issue. Check Motadata health from Motadata console.
Check For collector engine, if it is there or not, if it’s not there then it is killed and therefore devices going in Time Out.
Now need to check Systems Configuration (i.e: Free RAM, Free CPU, Free Disk.)
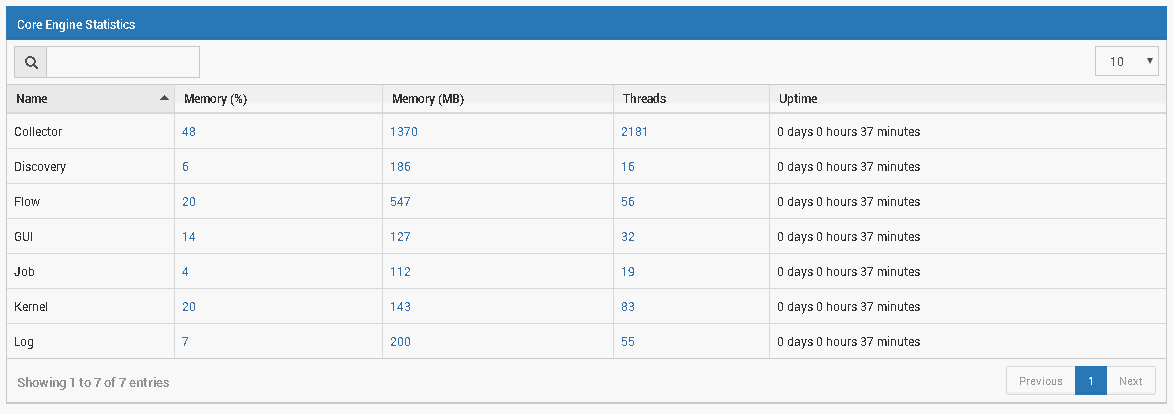
Can Also check RAM and CPU utilization and status from when polling is stopped.

From above snap you can check memory statics, and trend details.
Check motadata’s system-conf file at below location.
root@ubuntu:~# cd /motadata/motadata/config
root@ubuntu:~# vim system-conf.yml
Check if this option is yes (high-performance-metric-worker: “yes”), change it to no, because it’s not required till 1000 Monitors.
Check log files for any other issues.
Now stop motadata service remove logs, and start motadata service again.
##Case 2
Check For Machine statics like for example if having 20Windows machines 20Linux machines 20Routers 20Switches and having 150VM machines, so need to separate Maximum monitors for polling.
Ideal polling time for VMWare Machines is 10 to 12Minutes.
Change polling time for all VMWare ESXi Host and Machines time to 500secounds.
Need to mention below two lines in plugin file for metric’s yml file.
File: root@localhost:~# vim /motadata/motadata/plugins/metric-collector/vmware-metric-collector/plugin.yml:
plugin-max-queue-size: 1000
plugin-max-core-thread: 16
Core’s we can mention on behalf of server core’s maximum we can assign double of systems core not more then that.